
Fact-Based Diagnostics:How to Map the True State of a Cloud Data Platform
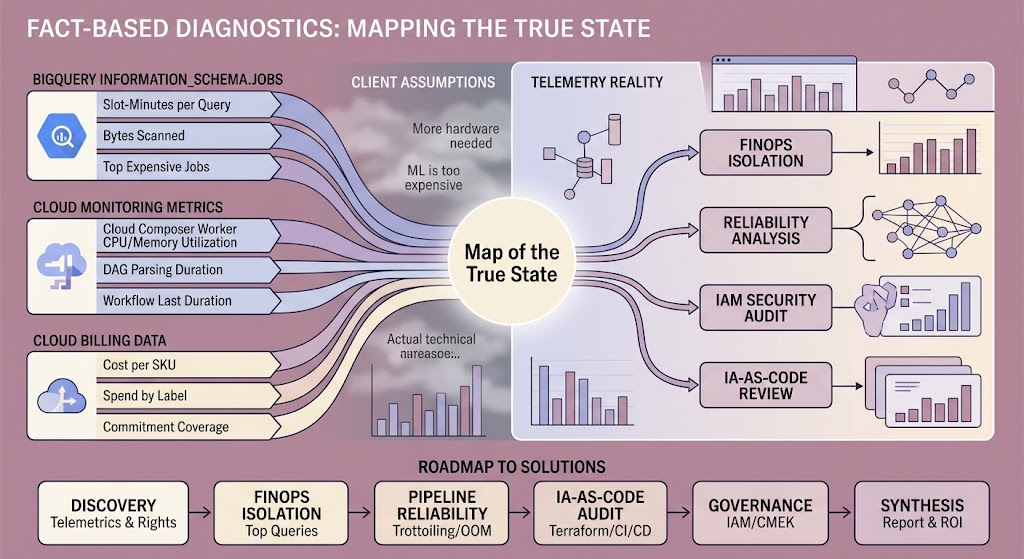
Every data engineering consultancy eventually sits across the table from a frustrated client who is absolutely certain they know what is broken. The narrative is always confidently delivered: the cloud bill is too high because data scientists are running complex machine learning models, the pipelines are failing because the orchestrator lacks sufficient RAM, and the reporting layer is slow because the data warehouse needs a more expensive tier.
The client presents you with their problem and asks for a direct solution. If you immediately begin fixing what they pointed at, you have already failed.
In the realm of cloud data engineering, a client’s architectural diagram is often an aspirational mood board rather than a reflection of physical reality. The symptom they observe (a high bill, a crashed pipeline) is rarely the actual disease. Therefore, the foundational rule of data consulting is this: You must start with the client’s words to understand their pain, but you must verify everything through empirical telemetry.
An audit—or a deep technical diagnostic—is not a bureaucratic formality. It is the mandatory first instrument in your arsenal. It is the only way to build an objective roadmap of actions, transforming assumptions into quantifiable engineering tasks. This article deconstructs the methodology of conducting a telemetry-first audit, comparing regional philosophies, defining the diagnostic toolkit, and providing a rigorous algorithm for uncovering the truth.
1. The Geography of Architectural Philosophies
Before deploying a single script, an auditor must understand the corporate and regional ecosystem of the client. An architecture that is considered “optimal” in one part of the world might be deemed a failure in another. We can categorize these approaches into three distinct operational philosophies.
| Philosophy / Region | Core Focus | Audit Priority | Success Metric |
| The Nordics (Scandinavia) | Decentralization, Speed, GreenOps | Developer Experience (DevEx), CI/CD bottlenecks, Carbon footprint of queries. | How fast a domain team can autonomously deploy a new pipeline. |
| Central Europe (DACH) | Compliance, Security, Centralization | Data Lineage, Strict RBAC (Role-Based Access Control), PII obfuscation. | Zero audit findings from regulatory bodies (GDPR, ISO 27001). |
| Google Cloud Native | Scale, Managed Services, Ephemeral Compute | ELT paradigm adherence, FinOps resource allocation, IAM least privilege. | Cost per query and Mean Time to Recovery (MTTR). |
Understanding this matrix dictates how you present your findings. A DACH client wants to see security compliance matrices; a Nordic client wants to see agility metrics and carbon reduction.
2. The Diagnostic Toolkit: Extracting the Truth
To conduct an empirical audit without relying on client testimony, you need tools that extract the truth directly from the infrastructure. A professional diagnostic relies on a mix of native cloud services and specialized open-source or commercial software.
Native Google Cloud Instruments
The greatest advantage of native tools is that they require zero deployment effort. They are always running in the background, waiting to be queried.
- BigQuery
INFORMATION_SCHEMA: The undisputed holy grail for FinOps. A system catalog that allows you to run SQL against the history of the data warehouse itself (JOBS,RESERVATIONS,TABLE_STORAGE). It reveals exactly who is burning compute slots and which tables are bloated. - Cloud Recommender (Active Assist): GCP’s built-in automated auditor. It scans projects for idle VMs, over-provisioned disks, unclustered BigQuery tables, and excessively permissive IAM roles.
- Cloud Monitoring (Metrics Explorer): The pulse of the orchestration layer. By writing MQL (Monitoring Query Language), you can detect CPU throttling on Cloud Composer workers, memory leaks, and network latency spikes.
- Dataplex: Google’s native data governance tool, excellent for automated data profiling and system-level lineage tracking.
The Third-Party Diagnostic Matrix
While native tools monitor infrastructure, third-party instruments are required to audit the logic and quality of the data itself.
| Instrument | Type | Primary Function | Rating | Key Audit Artifact |
| Elementary Data | Open-Source / dbt | Data Observability and dbt test monitoring. | 5/5 | Automated dashboard of volume anomalies and freshness drops. |
| Infracost | Open-Source / CLI | FinOps audit for Terraform manifests. | 4.8/5 | Financial impact report generated before infrastructure is deployed. |
| SQLFluff | Open-Source | Static SQL code analysis and linting. | 4.5/5 | List of anti-patterns (e.g., implicit joins, SELECT *). |
| Monte Carlo | Paid (SaaS) | Enterprise Data Observability and Lineage. | 4.7/5 | End-to-end blast radius map for incident management. |
| Datafold | Paid / Core OS | Data Diff testing during migrations. | 4.6/5 | Detailed row/column discrepancy report across pipeline versions. |
3. Industry Standard Audit Frameworks
You do not need to invent an audit checklist from scratch. The most effective diagnostics map their findings against established industry frameworks to provide objective authority.
- Google Cloud Architecture Framework: The ultimate standard for GCP. It evaluates the platform across five pillars: System Design, Operational Excellence, Security, Reliability, and Performance & Cost Optimization.
- FinOps Foundation Assessment: A maturity matrix (Crawl, Walk, Run) that evaluates how an organization allocates expenses, handles billing anomalies, and utilizes Commitment Discounts (CUDs).
- CIS Google Cloud Platform Benchmark: The definitive security checklist. It audits IAM policies, KMS encryption configurations, VPC perimeters, and logging sinks.
- dbt Labs Project Checklist: For modern data stacks, this framework audits the logical modeling layer, ensuring proper use of staging/mart layers, surrogate keys, and test coverage.
4. The Empirical Audit Algorithm
An audit is a sequential procedure. Jumping straight into code review without analyzing billing telemetry will result in solving the wrong problems. The following algorithm represents the gold standard for executing a diagnostic sprint.
1.Silent Discovery & Permissions:Trust nothing but the logs.
Obtain Read-Only and Metadata Viewer roles (e.g., roles/bigquery.metadataViewer, roles/monitoring.viewer). Export the last 60 days of Cloud Billing and Cloud Logging data into an isolated diagnostic dataset. Do not interview the engineers yet; gather the baseline facts.
2.FinOps & Compute Factorization:Follow the money.
Query INFORMATION_SCHEMA.JOBS_BY_PROJECT. Rank the top 20 most expensive queries by total slot-milliseconds and bytes scanned. Identify the 10% of workloads consuming 80% of the budget. Look for unpartitioned tables receiving high-frequency SELECT traffic.
3.Orchestration & Reliability Diagnostics:Analyze the pipelines.
Inspect Cloud Composer (Airflow) or Cloud Run metrics. Correlate DAG failure timestamps with worker node CPU/Memory utilization. Look for OOM (Out of Memory) kills, indicating that the orchestrator is being illegally used as a data processing engine.
4.Data Integrity & Logic Review:Check the payload.
Analyze data freshness and test failure rates (using tools like Elementary). Review the SQL repository (using SQLFluff) to identify inefficient analytical logic, missing constraints, and redundant staging layers.
5.Security & IAM Vulnerability Scan:Map the risks.
Audit Service Accounts for keys older than 90 days. Identify any pipeline or user holding the basic roles/editor or roles/owner roles instead of granular permissions. Verify that Cloud Storage buckets are not publicly exposed.
6.Synthesis & The Solutions Roadmap:Draft the matrix.
Translate technical debt into a business case. Format every finding as: “Problem → Evidence → Financial/Reliability Impact → Corrective Action → Projected ROI.” Categorize fixes into ‘Quick Wins’ and ‘Strategic Refactoring’.
5. Interpreting the Chaos: Heuristics and Anti-Patterns
Collecting data is only half the battle; interpreting it requires pattern recognition. Over hundreds of audits, specific architectural anti-patterns emerge consistently.
The “90/10” FinOps Illusion
When a client complains about BigQuery costs, they usually blame the analytics team. However, the audit almost invariably proves that human analysts are not the problem. The budget is being incinerated by 3 to 5 automated, cyclical service accounts running brute-force COUNT(DISTINCT) queries against raw data for a Looker dashboard that no one has looked at in three months.
The Orchestrator-as-a-Processor Sin
If a client states, “Airflow is unstable, we need to pay for a larger environment,” the diagnostic will usually reveal a fundamental misunderstanding of the ELT paradigm. Engineers are using Python Pandas inside Airflow operators to pull millions of rows into the worker’s RAM, filter them, and push them back. Airflow is a traffic cop, not a bulldozer. The solution is never more RAM; the solution is rewriting the DAG to execute a pushdown SQL query inside BigQuery.
6. The Execution: A Real-World Case Study
To see how the illusion of the client’s diagnosis shatters against empirical facts, let us examine a standard engagement with Acme E-Commerce.
The Client’s Premise:
Acme approached the consultancy with a request to migrate their data platform to a larger, more expensive tier of Cloud Composer and to buy a heavy BigQuery flat-rate capacity commitment.
Their reasoning: The morning sales reporting pipelines crash every day at 8:00 AM, and the BigQuery bill has tripled in the last two months despite no new business logic being deployed. They believed they had simply “outgrown” their infrastructure.
The Empirical Diagnostic (Applying the Algorithm):
We ignored their capacity planning request, secured Metadata Viewer permissions, and ran our standard 5-day Architecture Validation Sprint.
- Billing Reality Check: We queried the
INFORMATION_SCHEMA. The telemetry proved traffic had not increased. Instead, a singledbtmodel, deployed two months ago by a junior engineer, was configured as atablematerialization instead ofincremental. It was dropping and rebuilding a 35-Terabyte historical sales table from scratch, four times a day. - Orchestrator Autopsy: We checked Cloud Monitoring for the 8:00 AM crashes. The Airflow workers were hitting 100% memory utilization and being terminated by the Kubernetes
OOMKilledsignal. The logs showed an engineer was using aPythonOperatorto load XML files from an external SFTP directly into the worker’s memory before parsing them.
The Executive Report Matrix
Instead of a sprawling technical document, we delivered a precise roadmap based entirely on the audit findings:
| Finding | Client’s Assumption | Empirical Reality (The Log Truth) | Corrective Action | Projected Impact |
| BigQuery Cost Spikes | “We have too much data and need flat-rate capacity.” | A single dbt model is performing a daily 140TB brute-force rebuild of historical data. | Change dbt materialization to incremental. Enforce require_partition_filter = true on the target table. | -$18,500 / month. (Implemented in 2 hours). |
| Morning Pipeline Crashes | “Cloud Composer is under-provisioned; we need a bigger cluster.” | Python operators are downloading 5GB XML files into worker RAM, triggering Out-Of-Memory kills. | Replace Python code with GCP native Dataflow or a lightweight Cloud Function to parse files in a serverless, decoupled manner. | Zero crashes. MTTR reduced from 2 hours to 0. (Implemented in 4 days). |
| IAM Vulnerabilities | “Our platform is secure behind the VPC.” | 12 Service Accounts have roles/owner at the project level, creating massive blast-radius risks. | Run Active Assist IAM Recommender to generate least-privilege custom roles. | Compliance Achieved. (Implemented in 2 days). |
The Ultimate Value of the Audit
By relying on metrics rather than testimony, the diagnostic didn’t just solve the client’s problem—it completely invalidated their costly proposed solution. We prevented them from spending thousands of dollars on heavier infrastructure to support fundamentally broken code.
An audit is not a critique of the client’s team; it is an objective lens. When a data engineering boutique masters the art of the empirical diagnostic, they cease to be mere order-takers. They become architects of truth, using telemetry to cut through the noise and deliver precision engineering where it actually matters.