
The modern B2B and e-commerce customer journey is complex. A user might interact with your brand 6 to 15 times before making a purchase. Yet, most businesses still rely on default analytics that operate in isolated silos. Advertising platforms like Google or Meta claim overlapping credit for the same conversions, optimizing their algorithms for gross revenue. They count a sale when a user clicks a button, completely ignoring what happens in your CRM afterward—like high logistics costs, unpaid invoices, or the 30–40% return rates common in European retail.
At the same time, the legal landscape in Europe and Scandinavia has fundamentally changed the rules of data collection. Under GDPR and Consent Mode v2, 15 to 35% of users reject tracking cookies. Attempting to bypass these rules by secretly capturing platform identifiers on the server side is illegal and carries severe financial risks. As a result, businesses are left with fragmented data: you see the final purchase, but you lose the long journey that led to it.
You cannot solve this problem with out-of-the-box dashboards. You need a robust engineering solution that respects privacy laws, accepts data fragmentation as a reality, and uses data science to bridge the gaps and calculate real profit.
Below is the exact blueprint of how we solve this.
Building Multi-Touch Attribution and End-to-End Unit Economics in BigQuery
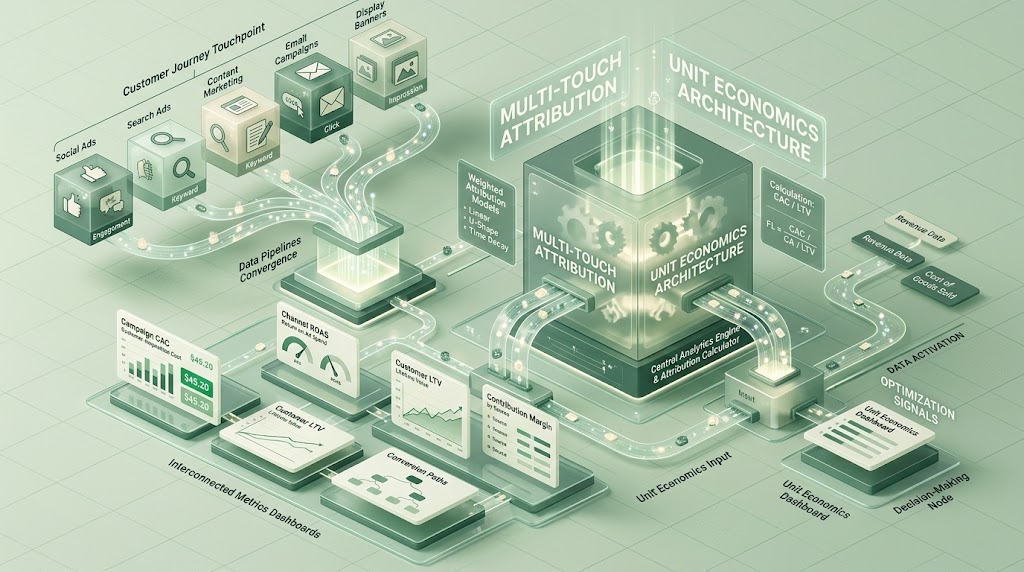
The architecture of the service for transforming raw logs into ready-made financial analytics consists of the following functional blocks:
1. Baseline Attribution (Rule-Based / Baseline)
Implementation of 8 static SQL models : First-Click, Last-Click, Last Non-Direct Click, Linear, Time Decay, U-Shape, W-Shape, Custom.
- Application: Provides technical benchmarking. The First-Click and Last Non-Direct models are used to compare the data warehouse numbers with reports from advertising platforms and Google Analytics 4.
2. Algorithmic Level (Data Science)
Programming the dynamic distribution of conversion value using Python (Cloud Functions / BQ DataFrames).
- Markov Chains: Calculating the probability of losing a conversion when a specific source is removed from the touchpoint chain (Removal Effect).
- Shapley Value: Calculating the marginal contribution of each channel across all possible combinations.
- Application: Objective evaluation of assisting channels in long conversion paths (6–15 touchpoints).
3. End-to-End Unit Economics (API + Web + CRM) Integration of three independent data streams into a single Data Mart:
- ELT of Advertising Costs: Automatic import of aggregated data (Spend, Clicks, Impressions) from Google Ads, Meta, LinkedIn, and CPA network APIs.
- Mapping and Source Recovery: Matching the cost table with user session logs. While we use a composite key (Date + utm parameters) as a baseline, the system also acts as a failsafe. If a session is falsely attributed to “Direct” due to missing UTMs or cross-domain redirects, the pipeline scans raw logs for unique platform identifiers (e.g.,
gclid,fbclid,click_id). By joining these identifiers with the API data, we deterministically recover the true campaign source, eliminating human error in link tagging. - Financial Adjustment: Extracting statuses from the ERP/CRM. Replacing gross revenue with net profit (Net Profit = Revenue − COGS − Logistics − Cancellations/Returns).
4. Privacy-First Contour (Consent Mode Processing)
The dbt architecture is split into two streams to comply with GDPR:
- Training Contour: Algorithms (Markov/Shapley) calculate channel weights exclusively on a sample of users who gave consent (where cross-session stitching is available).
- Extrapolation Contour: Opt-outs are collected via cookieless pings (server-side generation of an isolated session_id). The attribution weights calculated in the first step are proportionally applied to the total transaction volume of the opt-outs.
5. Data Activation (Reverse ETL and Conversion Sending)
The final stage of the architecture, turning warehouse analytics into a tool for direct ad campaign optimization.
- Sending Conversions: Automatic transfer of transaction data back to ad accounts (Google Ads, Meta via Conversions API, affiliate CPA networks via Postback).
- Transferring Net Profit: Platforms receive cleaned conversion value (Net Profit) adjusted for returns, cancellations, and the algorithmic weight of the channel, rather than just gross revenue.
- Strict Compliance (GDPR): Sending advertising identifiers (Click ID, PII) and the fact of conversion to external platforms is performed strictly for the pool of users who gave explicit consent for tracking (Consent Granted).
- Application: Retraining Smart Bidding algorithms (Target CPA, Target ROAS) to find audiences that generate actual profit for the business, not empty clicks.
Case in Practice: A European FinTech Provider
To understand how this infrastructure translates into business value, consider a mid-sized European financial technology company offering corporate credit lines. Their standard sales cycle lasts 3 to 6 weeks.
Before implementing the pipeline, their default analytics showed that Google Ads (Branded Search) generated 75% of all client registrations. Meanwhile, their LinkedIn Ads campaigns showed a massive Cost Per Acquisition (CPA) and appeared highly unprofitable. At the same time, they were buying traffic from CPA networks that delivered thousands of “cheap” sign-ups.
Once the Advanced Multi-Touch Attribution pipeline was deployed, the reality shifted completely:
- Algorithmic Truth: The Markov model revealed that LinkedIn was the essential first touchpoint for 40% of their highest-value clients. Without the initial LinkedIn exposure, users never searched for the brand on Google. Pausing LinkedIn would have collapsed their search volume.
- CRM Integration: The Unit Economics block exposed a critical flaw in the CPA network traffic. By linking web sessions to the backend CRM, the pipeline revealed that 80% of the “cheap” sign-ups failed mandatory KYC (Know Your Customer) compliance checks or were rejected for credit by the risk department.
- Net Profit Calculation: The system recalculated the true Net CAC based exclusively on approved and funded credit lines, subtracting the ad spend. The seemingly “profitable” affiliate traffic was actually burning the budget, while LinkedIn yielded a highly positive Net ROAS despite its high initial click cost.
- The Loop Closure: Using Reverse ETL, the company stopped sending basic “Registration” events to the advertising platforms. Instead, they sent “KYC Approved & Funded” signals with the actual credit margin value attached (strictly for users who granted consent). Google and Meta’s Smart Bidding algorithms instantly stopped chasing low-quality, fraudulent traffic and recalibrated to hunt for legitimate corporate clients.
The Next Step: Audit and Architecture
Let’s start with a practical first step. We invite you to order a comprehensive technical audit of your existing tracking system. We will evaluate your data flow, identify blind spots, expose legal risks in your tracking setup, and find where your ad budget is burning.
If you do not have a data warehouse or an attribution system in place yet, our first step will be designing a custom architecture blueprint tailored exclusively to your business. Let’s build analytics that actually drive your financial growth.
ablished, the engagement begins with designing the BigQuery pipeline architecture tailored directly to your specific CRM structure and sales cycle.