
BigQuery Materialized Views vs Scheduled Queries: Which One Actually Saves Money?
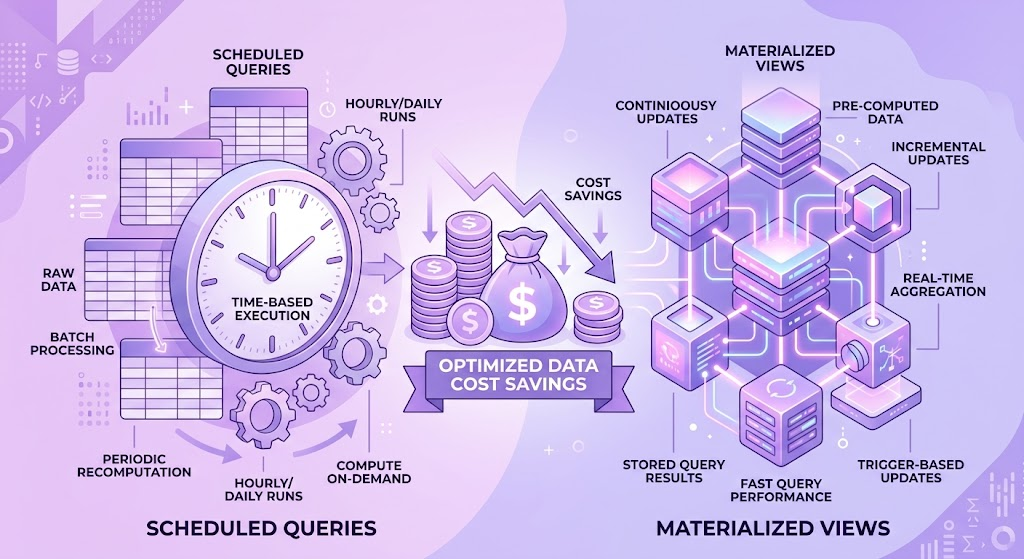
One of the most persistent myths in the BigQuery ecosystem is surprisingly simple.
Materialized Views always reduce costs.
The statement sounds logical. Google recommends them for accelerating repeated analytical workloads, conference presentations demonstrate impressive benchmark improvements, and architecture diagrams often present Materialized Views as the obvious solution whenever dashboards become slow.
The problem is not that the recommendation is wrong.
The problem is that it is incomplete.
This investigation began after a retail company operating across seven European countries noticed a paradox that should not have existed.
Dashboard performance had improved significantly during the previous six months.
Cloud costs had not.
The company processed approximately 1.2 billion customer events every day, maintained over 600 scheduled analytical models, and served around 1,800 internal dashboard users through Looker.
Business growth looked healthy.
Average daily traffic increased by 14%.
Data volume increased by 17%.
Monthly BigQuery costs increased by 39%.
The engineering team initially celebrated the improvements because dashboard response times had fallen from approximately 11 seconds to less than 2 seconds for most business users.
Executives were happy.
Analysts were happy.
Finance was not.
Cloud Billing Export identified an unexpected trend.
Query costs had indeed decreased.
However, another category had increased almost proportionally.
Background computation.
Something inside the platform had begun consuming compute resources continuously—even when nobody was running reports.
The investigation started with a simple inventory.
Every analytical acceleration mechanism deployed during the previous year was documented.
The platform contained:
| Optimization Technique | Count |
|---|---|
| Materialized Views | 148 |
| Scheduled Queries | 392 |
| Incremental Dataform Models | 176 |
| BI Engine Reservations | 9 |
| Standard Views | 840 |
Nothing looked unusual.
Until the engineers compared usage statistics.
Using BigQuery Audit Logs together with Looker query history, they measured how frequently every Materialized View had actually been used.
The findings challenged one of the company’s core architectural assumptions.
Of the 148 Materialized Views:
- 34 were queried hundreds of times every day.
- 41 were queried only a few times each week.
- 27 had not been queried for more than 60 days.
- 19 had never been queried after deployment.
- The remaining views showed highly irregular usage.
The architecture team initially assumed the unused views represented negligible cost.
That assumption lasted until Cloud Billing Export was correlated with refresh statistics.
Unlike standard views, Materialized Views are not free simply because nobody opens a dashboard.
They must remain synchronized with source tables.
Every incoming change potentially triggers maintenance work.
The company calculated the monthly economics of one representative reporting model.
The dashboard itself was opened an average of 22 times per month.
The corresponding Materialized View processed source table updates every few minutes.
Monthly maintenance cost:
Approximately $640.
Monthly query savings:
Approximately $74.
The optimization generated a net financial loss of almost $570 every month.
One view was insignificant.
The engineering team wanted to understand the platform-wide impact.
They exported metadata for every Materialized View and calculated four business metrics:
- monthly maintenance cost;
- monthly query savings;
- refresh frequency;
- actual user demand.
Only after combining all four did the real picture emerge.
The majority of Materialized Views were technically correct.
Many of them were economically irrational.
The next phase of the investigation focused on one question.
Under what conditions does a Materialized View become cheaper than a Scheduled Query?
Surprisingly, the answer had almost nothing to do with SQL complexity.
It depended on something far simpler.
How often humans actually looked at the data.
The engineering team decided to stop debating architecture preferences and let the numbers determine the answer.
Instead of comparing SQL syntax or benchmark results, they built a simple cost model using 90 days of production telemetry from four sources:
- Cloud Billing Export
- BigQuery
INFORMATION_SCHEMA.JOBS - BigQuery Audit Logs
- Looker usage statistics
The objective was straightforward.
For every reporting workload, calculate the real monthly cost of three different implementation strategies:
- Materialized View
- Scheduled Query writing into a reporting table
- Standard View executed on demand
The comparison covered 148 Materialized Views, 392 Scheduled Queries, and over 12 million dashboard executions.
The results immediately disproved the company’s existing design standards.
Workload A — Executive Sales Dashboard
Business characteristics:
- Viewed 4,800–5,300 times per day
- Source table updated every minute
- Query complexity: High
- Average query before optimization: 7.8 TB scanned
| Option | Monthly Cost | Avg. Response |
|---|---|---|
| Standard View | $23,900 | 8.9 sec |
| Scheduled Query | $6,700 | 1.9 sec |
| Materialized View | $3,400 | 0.8 sec |
Materialized View clearly won.
Refresh costs were insignificant compared with the enormous reduction in repeated query execution.
Every dashboard request reused precomputed results thousands of times.
This was exactly the scenario Materialized Views were designed for.
Workload B — Regional Marketing Dashboard
Business characteristics:
- Viewed 18–25 times per month
- Source data updated every 10 minutes
- Query complexity: Medium
| Option | Monthly Cost | Avg. Response |
| Standard View | $42 | 3.4 sec |
| Scheduled Query | $61 | 0.9 sec |
| Materialized View | $618 | 0.8 sec |
This result surprised nearly everyone.
Materialized View delivered the fastest dashboard.
It also cost almost 15 times more than simply executing the query when needed.
The platform spent money refreshing data that nobody was reading.
Workload C — Monthly Financial Report
Characteristics:
- Generated once every month
- Consumed by Finance
- Large aggregation across historical transactions
| Option | Monthly Cost | Avg. Response |
| Standard View | $126 | 41 sec |
| Scheduled Query | $37 | Instant |
| Materialized View | $812 | Instant |
Again, Scheduled Queries outperformed every alternative economically.
Computing the result once each night was dramatically cheaper than maintaining a continuously refreshed Materialized View.
The engineering team stopped looking at SQL.
Instead, they started looking at human behavior.
One statistic changed the company’s architecture guidelines permanently.
More than 72% of reporting assets were opened fewer than 50 times per month.
Only 9% were viewed more than 500 times per day.
Yet almost every optimization project during the previous two years had defaulted to Materialized Views.
The company had optimized for theoretical performance instead of actual demand.
To understand the financial impact, engineers created a simple decision matrix.
| Dashboard Usage | Recommended Solution |
| Thousands of executions per day | Materialized View |
| Hundreds per day | Compare MV vs Scheduled Query |
| Tens per week | Scheduled Query |
| Rare or ad-hoc analysis | Standard View |
This single table became part of every architecture review.
More importantly, it introduced a concept the company had never formally discussed:
Optimization must have an economic justification.
Not every performance improvement deserves implementation.
For example, reducing dashboard latency from 2.1 seconds to 0.7 seconds looked impressive during demonstrations.
User telemetry showed that nobody cared.
However, reducing monthly cloud spending by $18,000 while keeping dashboard response under three seconds generated immediate business value.
The investigation also revealed another hidden cost.
Materialized Views created architectural dependency.
Whenever source schemas changed, dependent Materialized Views required validation, refresh testing, and deployment checks.
Over two years, the company estimated that engineers had spent approximately 420 hours maintaining Materialized Views that collectively saved less than $9,000 annually.
The maintenance cost exceeded the infrastructure savings.
That realization fundamentally changed the team’s design philosophy.
From that point onward, every proposal to introduce a Materialized View required answers to five questions:
- How many times will this data actually be queried?
- What is the monthly refresh cost?
- How much query cost will it eliminate?
- Is response time already acceptable?
- Would a Scheduled Query achieve the same business outcome at lower operational cost?
If those questions could not be answered with evidence, the Materialized View was not approved.
Six months after adopting the new framework, the company reviewed the outcome.
The number of Materialized Views decreased from 148 to 61.
Scheduled Queries increased modestly.
Average dashboard performance remained virtually unchanged.
Monthly BigQuery costs fell by approximately $27,000, representing more than $320,000 in annual savings.
Equally important, the analytical platform became easier to understand.
Architects no longer debated technologies.
They discussed economics.
That subtle shift produced better technical decisions than any optimization technique alone.
The lesson from the investigation was remarkably simple.
Materialized Views are powerful.
Scheduled Queries are powerful.
Neither is universally better.
The wrong optimization applied to the wrong workload is not optimization at all.
It is simply another recurring cloud expense.
Evidence Collected
- Cloud Billing Export
- BigQuery
INFORMATION_SCHEMA.JOBS - BigQuery Audit Logs
- Looker dashboard usage history
- Materialized View refresh statistics
- Dataform execution history
- Cloud Monitoring performance metrics
Executive Recommendations
- Never introduce a Materialized View without calculating its refresh cost.
- Measure dashboard usage before optimizing performance.
- Treat response time as a business metric, not an engineering trophy.
- Review optimization decisions every six months as usage patterns evolve.
- Optimize for cost per business decision, not for benchmark numbers.
The Question Every CTO Should Ask
“Are we paying to accelerate dashboards that people actually use—or dashboards that looked impressive during the architecture review?”