
BigQuery Data Partitioning Best Practices: How One Missing WHERE Clause Increased Cloud Costs by 312%
Every BigQuery optimization guide mentions partitioning.
Almost none explain what happens when partitioning exists, is correctly configured, and still saves absolutely nothing.
This investigation started after a routine FinOps review at a European fintech company processing approximately 480–520 million events every day. The analytical platform had grown steadily for nearly four years and consisted of more than 1,900 production tables, 430 scheduled transformations, 67 Looker semantic models, and approximately 160 TB of active analytical data.
Monthly BigQuery spending averaged $86,000, fluctuating by less than five percent. Nothing suggested an operational problem.
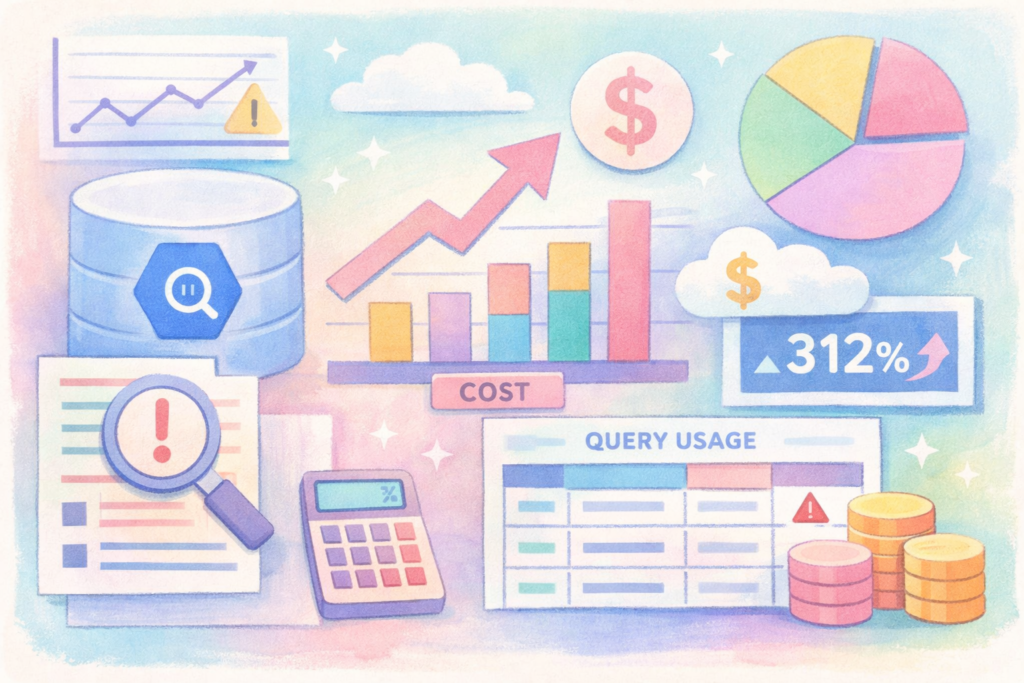
The anomaly appeared during a quarterly cost trend analysis.
Although traffic had increased by only 18% over the previous twelve months, BigQuery query costs had increased by almost 74%. Storage costs remained almost unchanged, streaming costs were stable, and slot utilization showed no unusual behavior.
The first hypothesis was predictable.
Perhaps several expensive analytical projects had recently gone into production.
Cloud Billing Export disproved that assumption within minutes.
The second hypothesis looked more convincing.
Perhaps analysts had started running more ad-hoc queries.
Again, the evidence disagreed.
The total number of completed queries during the previous month differed by less than 6% from historical averages.
The company was not executing significantly more SQL.
It was executing SQL that scanned dramatically more data.
That distinction determined the direction of the investigation.
Instead of looking at invoices, the engineering team extracted statistics from INFORMATION_SCHEMA.JOBS_BY_PROJECT for the previous ninety days. Every completed query was classified according to five characteristics:
- bytes processed;
- execution frequency;
- execution duration;
- user or service account;
- referenced tables.
More than 5.1 million query executions were analyzed.
The distribution immediately exposed something unusual.
Only 31 scheduled jobs were responsible for almost 58% of all scanned data.
The engineering team expected to find complex machine learning workloads or large financial reconciliation jobs.
Instead, the largest consumer was a reporting pipeline that generated a dashboard used by regional marketing managers every morning.
The dashboard itself was simple.
Daily conversions.
Traffic sources.
Campaign costs.
Customer acquisition.
Nothing extraordinary.
The SQL behind it was equally ordinary.
At least at first glance.
The source table contained approximately 4.8 billion rows and was partitioned by event_date.
Partitioning had been implemented correctly.
Clustering had also been configured.
Documentation described the table as fully optimized.
Yet every scheduled execution scanned the entire table.
The team calculated the numbers.
Average data scanned:
18.6 TB
Execution frequency:
Every 30 minutes
Executions per day:
48
Average cost per execution:
Approximately $93
Daily cost:
$4,464
Monthly cost:
Approximately $134,000
One reporting query consumed more money than the company’s entire Kubernetes infrastructure.
That should have been impossible.
Partitioning existed specifically to prevent this scenario.
The engineers downloaded the execution plan using BigQuery’s query statistics.
Storage pruning showed almost no reduction.
Partition pruning:
0%
Cluster pruning:
Less than 3%
BigQuery behaved exactly as instructed.
It simply had no opportunity to eliminate unnecessary partitions.
Attention shifted from infrastructure to SQL.
The original query had been written almost three years earlier, when the table contained fewer than 140 million rows. At that time, scanning the complete dataset required less than 600 GB, completed in under ten seconds, and cost almost nothing.
The business grew.
The SQL never evolved with it.
The investigation uncovered an even more surprising detail.
The dashboard displayed only the previous 30 days of activity.
The underlying SQL scanned every day since the platform had been launched.
The difference between business requirements and technical implementation exceeded four years of historical data.
At this point, most optimization projects would simply add a date filter and declare success.
The engineering team deliberately avoided that temptation.
Experience suggested that expensive SQL rarely exists in isolation.
If one production query ignored partitioning, others almost certainly did the same.
A second analysis was launched.
Every scheduled query referencing partitioned tables was examined automatically.
The objective was no longer to optimize one dashboard.
The objective was to discover whether the company had accidentally developed an engineering habit that had remained invisible for years.
What happened next explained why cloud costs had continued increasing despite every table being “properly partitioned.”
And the missing WHERE clause turned out to be only the beginning.
Finding one inefficient query solved nothing.
It only proved that an inefficient query existed.
The real question was whether the company had discovered an isolated mistake or uncovered a systematic engineering problem that had been quietly increasing cloud costs for years.
The investigation expanded from one SQL statement to the entire analytical platform.
Using INFORMATION_SCHEMA.JOBS_BY_PROJECT, the engineering team extracted every production query executed during the previous ninety days against partitioned tables. The objective was simple: identify queries where the scanned data volume remained almost identical regardless of the requested reporting period.
The analysis covered 437 scheduled production jobs.
The results were impossible to ignore.
| Finding | Number |
|---|---|
| Scheduled jobs analyzed | 437 |
| Jobs reading partitioned tables | 289 |
| Jobs using effective partition pruning | 117 |
| Jobs scanning all partitions | 126 |
| Jobs with partially effective pruning | 46 |
In other words, less than half of the company’s production workloads actually benefited from partitioning.
The remaining jobs paid the full cost of reading historical data that nobody needed.
The engineers classified every inefficient query into categories.
The largest group, representing 41% of all expensive jobs, simply omitted a partition filter. The SQL was technically correct, but it forced BigQuery to evaluate every partition before producing a result.
The second category surprised everyone.
Nearly 28% of the queries contained a date filter, but the filter had been wrapped inside functions such as DATE(), CAST(), or arithmetic expressions applied to the partition column.
For example, instead of filtering directly on the partition key, developers had written logic equivalent to:
DATE(event_timestamp) = CURRENT_DATE()EXTRACT(DATE FROM event_timestamp)TIMESTAMP_TRUNC(event_timestamp, DAY)
From a business perspective, these expressions were perfectly valid.
From BigQuery’s optimizer perspective, they prevented efficient partition pruning.
The SQL engine could no longer eliminate irrelevant partitions before execution because the partition column had first been transformed by another function.
The third category exposed a governance problem rather than a technical one.
Several Dataform models generated incremental tables correctly.
Downstream reporting queries ignored those incremental outputs and continued reading raw event tables containing billions of records.
Engineers had invested weeks building optimized transformation layers.
Analysts continued querying the raw data because nobody had documented which tables should be used for reporting.
The platform had become technically mature.
Its usage had not.
The engineering team wanted measurable evidence before implementing changes.
Five representative workloads were optimized while everything else remained untouched.
| Metric | Before | After |
| Average data scanned | 18.6 TB | 640 GB |
| Average execution time | 174 sec | 16 sec |
| Cost per execution | $93 | $3.20 |
| Daily executions | 48 | 48 |
| Monthly cost | $134,000 | $4,608 |
One missing filter had not increased costs by a few percent.
It had increased them by almost 2,800% for that workload.
The optimization itself required less than twenty minutes, including testing.
That observation led to another uncomfortable question.
Why had code review failed to detect something so obvious?
The answer had little to do with SQL expertise.
Every code review focused on correctness.
Almost none evaluated economics.
If the query returned accurate numbers and completed successfully, reviewers considered it production-ready.
Nobody asked:
- How many terabytes does this query scan?
- How much will it cost if data volume grows tenfold?
- Does the SQL benefit from partition pruning?
- Is this reading curated data or raw events?
- Will this still be acceptable two years from now?
Performance and cost had never become mandatory review criteria.
The company decided that changing SQL was not enough.
Engineering standards had to change.
Every production deployment now generated an automated review report containing:
- estimated bytes processed;
- expected monthly execution cost;
- partition pruning efficiency;
- clustering efficiency;
- historical trend compared with previous query versions.
Any scheduled query expected to scan more than 500 GB per execution required explicit architectural approval.
Dataform pipelines received additional validation rules that rejected models reading partitioned tables without eligible partition predicates.
Cloud Monitoring dashboards began tracking TB scanned per business KPI, not merely total BigQuery spending.
That final metric proved unexpectedly valuable.
Instead of asking why the monthly invoice had increased, executives could now ask why generating one customer acquisition report required scanning 18 TB instead of 600 GB.
The discussion shifted from accounting to engineering quality.
Three months after the governance changes, the results were independently verified using Cloud Billing Export.
Monthly BigQuery analysis costs decreased from $86,000 to approximately $57,400, despite transaction volume continuing to grow by nearly 11%.
Total scanned data fell by 61%.
Average dashboard response time improved by 44%.
No hardware was upgraded.
No slots were purchased.
No architecture migration took place.
The company simply started using the architecture it had already built.
The most valuable lesson did not concern partitioning itself.
It concerned assumptions.
Executives believed partitioning automatically reduced costs.
Engineers believed creating partitioned tables completed the optimization.
Both assumptions were incomplete.
Partitioning is not a feature that saves money.
It is an opportunity to save money.
The savings appear only when every query is written to exploit it.
That distinction cost the company almost $350,000 per year.
It took one missing WHERE clause to reveal it.
Evidence Collected
- Cloud Billing Export
INFORMATION_SCHEMA.JOBS_BY_PROJECT- BigQuery Query Execution Plans
INFORMATION_SCHEMA.PARTITIONS- Cloud Monitoring metrics
- Dataform lineage graph
- Looker query history
- Git commit history of production SQL
Executive Recommendations
- Never approve production SQL without reviewing bytes processed, not only execution time.
- Make partition pruning a mandatory code review criterion.
- Measure cost per report, not only total cloud spend.
- Treat raw event tables as engineering assets, not reporting sources.
- Review expensive queries every quarter. Data grows continuously; SQL rarely improves by itself.
The Question Every CTO Should Ask
“If every production query were executed against ten times more data tomorrow, which ones would still be economically sustainable?”