
The Limits of Standard Cost Optimization
Cloud infrastructure scales flawlessly, and so do the invoices. For enterprise data teams, managing Google Cloud Platform (GCP) expenses—particularly BigQuery OPEX—is not about stopping growth; it is about ensuring that every dollar spent generates actual business value. Cloud costs are controllable, but the depth and efficiency of that control vary significantly from company to company.
Standard optimization usually begins with GCP’s built-in billing reports. These reports are highly accurate at the macro level. They tell you exactly how much your organization spent on storage or compute over a month. However, they hit a hard limit when you need to understand the physical reality behind those numbers.
When the BigQuery bill increases by 30%, standard reports cannot answer the fundamental question: Why?
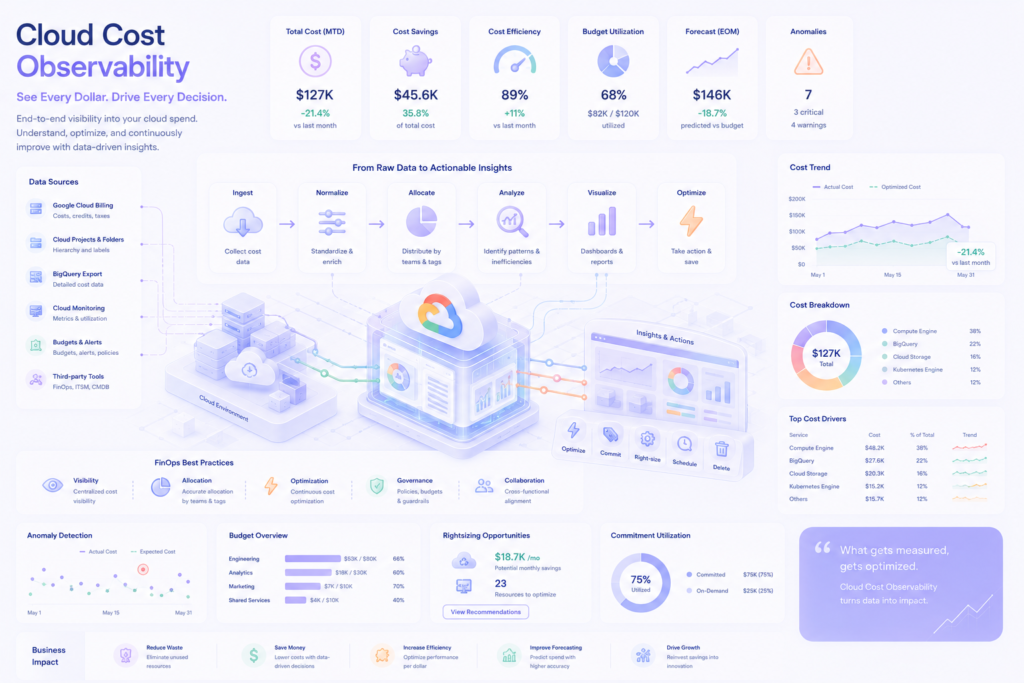
Was the spike caused by a complex, highly profitable attribution model calculating marketing ROI? Or did a junior analyst run a poorly optimized query across three years of unpartitioned data? Standard billing shows you the total sum, but it does not connect the technical action to the business unit.
To bridge this gap between raw cloud expenses and unit economics, organizations typically face a strategic choice between two distinct paths.
The Two Paths to Cloud Cost Intelligence
Path A: The Off-the-Shelf SaaS Solution The market offers dozens of third-party SaaS platforms for FinOps and Data Observability. For many companies, this is a highly convenient and valid route. It provides a quick setup, pre-built dashboards, and immediate alerts.
However, for mature data teams and CFOs who calculate long-term Total Cost of Ownership (TCO), this convenience introduces new structural trade-offs:
- Recurring Licensing: You pay an ongoing subscription fee based on user seats or the volume of logs processed.
- Egress Costs: To monitor your GCP environment, you must export terabytes of audit logs and metadata to the vendor’s external servers. Google charges you for this outbound data traffic.
- Loss of Sovereignty: Your infrastructure metadata—details about your schemas, user activity, and architecture—leaves your secure corporate perimeter.
Path B: The Custom In-House Architecture This is the alternative for enterprises that view infrastructure monitoring not as a software subscription, but as a core engineering asset. Instead of buying a third-party tool, you engineer a custom FinOps framework entirely within your existing GCP project.
This approach leverages the native APIs you already have. It eliminates recurring vendor fees, prevents data from ever leaving your secure environment, and allows you to align technical metrics precisely with your unique business logic.
| Criterion | Off-the-Shelf SaaS | Custom Native Architecture |
|---|---|---|
| Data Perimeter | Telemetry leaves your GCP environment | 100% Data Sovereignty (Data stays internal) |
| Cost Structure | Monthly licensing + GCP Egress fees | One-time engineering CAPEX + minimal native storage costs |
| Customization | Rigid, vendor-defined templates | Fully mapped to your specific corporate departments and KPIs |
| Vendor Lock-in | High (Loss of historical data if canceled) | Zero (You own the code and the data) |
If your priority is absolute data security, financial transparency, and the ability to link a single SQL query directly to a specific department’s budget, the custom native path is the optimal choice.
In the following sections, we will break down the two levels of this architecture (Platform vs. BigQuery), the exact GCP tools required, and how to turn dry system logs into a financial command center.
The Two-Tiered Architecture: Platform FinOps and BigQuery Observability
Every enterprise has a different center of gravity regarding cloud expenditures. For some organizations, the financial complexity lies in managing dozens of interconnected computing and networking services. For others, a single data warehouse consumes the vast majority of the IT budget.
To address these distinct realities, a custom observability framework must be engineered across two operational layers. This allows the business to deploy only what it actually needs.
Level 1: Macro-FinOps (The GCP Platform)
This layer provides a unified, top-down view of the entire Google Cloud ecosystem. It is designed for CFOs and Enterprise Architects who must govern multiple projects, environments, and distributed teams.
The primary objective at the macro level is strict resource allocation and waste elimination:
- Cost Allocation via Business Logic: Standard billing shows how much “Compute Engine” costs. We enforce structural resource tagging (labels) to translate that into business language. Infrastructure expenses are allocated directly to specific domains—clearly separating the budget burned by the Data Science sandbox from the costs of the Production E-commerce backend.
- Idle Resource Eradication: Cloud environments frequently accumulate technical debt. The system automatically identifies orphaned persistent disks, unattached static IP addresses, and underutilized virtual machines that continue to drain the monthly budget without providing computational value.
- Commitment Utilization Tracking: For predictable workloads, Google offers Committed Use Discounts (CUDs). The macro dashboard tracks the efficiency of these commitments, ensuring the business is not overpaying for on-demand pricing where baseline capacity could be easily secured at a discount.
Level 2: Micro-FinOps and Data Observability (BigQuery)
BigQuery is an exceptionally powerful engine capable of scanning petabytes in seconds. However, because its pricing model is tied to the volume of data processed, a single unoptimized SQL query can cost more than an engineering team’s daily infrastructure overhead.
This micro-level is engineered for CDOs, Head of Analytics, and DataOps teams. It bypasses general billing and dives directly into the database engine’s telemetry:
- Query-Level Financial Footprint: We track the exact USD/EUR cost of every executed SQL statement. By mapping query logs to specific users, service accounts, or BI tools (such as Looker Studio or PowerBI), the business sees exactly who—or what automated script—is consuming the budget.
- Cache Efficiency Analysis: Google does not charge for BigQuery results retrieved from the system cache. We monitor the cache hit ratio to identify poorly constructed data pipelines. For example, queries that unnecessarily use dynamic time functions force the engine to bypass the cache and process raw data from scratch, making the business pay multiple times for identical computational outputs.
- Storage vs. Compute Matrix: Not all stored data generates value. The framework analyzes the matrix of physical storage costs versus query frequency. This immediately highlights “dead” terabytes—massive tables that cost thousands of euros to maintain but have not been queried in months. These assets are flagged for partition restructuring or migration to cheaper, long-term cold storage.
By separating the architecture into these two tiers, the business gains the exact leverage required to control both broad infrastructure sprawl and hyper-specific database inefficiencies.
The Technical Foundation: Unlocking Native GCP Telemetry
The core philosophy of a custom FinOps and Data Observability architecture is zero interference. We do not install external agents that consume compute resources, create latency in your ETL pipelines, or introduce security vulnerabilities.
Instead, the framework is built entirely upon the native telemetry that Google Cloud already generates by default. Most enterprises already pay for the storage of these logs; they simply do not transform them into actionable intelligence. By tapping directly into these native APIs, we extract precise metrics without adding any operational overhead.
The architecture relies on four foundational pillars of GCP telemetry:
1. Cloud Billing Export to BigQuery
This is the financial baseline. Standard billing interfaces only show aggregated monthly sums. By enabling continuous detailed export to BigQuery, we capture every granular cost event down to the fraction of a cent. This includes exact pricing per Service Keeping Unit (SKU), regional data transfer costs, and most importantly, custom labels (tags). This allows us to tie a specific dollar amount directly to the infrastructure’s business logic.
2. Cloud Audit Logs (Data Access & Admin Activity)
Financial data means little if you do not know who initiated the expense. Cloud Audit Logs provide an immutable record of identity and execution. We extract exact details: which specific employee (email) or automated BI system (service account) triggered a process, from which IP address, and at what exact second. Furthermore, these logs capture system error codes, creating a vital registry for debugging failed pipelines.
3. BigQuery INFORMATION_SCHEMA
This is the central nervous system for Data Observability. The INFORMATION_SCHEMA provides deep, real-time metadata about the database engine itself. We extract specific operational metrics:
- Query Metrics: The exact volume of data scanned (in bytes) and the computational slots consumed by every single SQL statement.
- Cache Utilization: Boolean flags indicating whether a query was processed for free via the system cache or if it forced a paid scan.
- Storage Metrics: The logical and physical weight of every table and partition, highlighting storage bloat and inactive datasets.
4. Recommender API
To optimize the macro-level platform, we integrate Google’s native machine learning recommendations. This API automatically flags infrastructural waste, such as idle virtual machines, unattached persistent disks, and over-provisioned IAM (Identity and Access Management) permissions.
The Engineering Process: From Raw Logs to Intelligence
Raw logs are unstructured and difficult to read. The engineering value of our service lies in the transformation layer.
We route all these disparate telemetry streams into a strictly isolated, dedicated BigQuery project. Within this secure perimeter, we use standard data modeling tools (such as Dataform or dbt) to clean, join, and aggregate the raw data.
We merge the financial data (Billing) with the metadata (INFORMATION_SCHEMA) and identity logs (Audit). The result is a series of clean, structured data marts ready for visualization. There is no proprietary magic or black-box algorithms involved—only rigorous, transparent data engineering that operates entirely within your sovereign cloud environment.
Cloud Cost Intelligence: The Metrics Architecture
Raw telemetry is useless without business context. The core value of a custom FinOps framework lies in the transformation layer, where disparate system logs are joined to answer exact financial questions. By bridging the gap between technical execution and business intent, we create true Cloud Cost Intelligence.
Here is how we combine native logs to generate actionable, real-time dashboards for management:
1. The Financial Footprint of Users and Scripts
- The Integration:
INFORMATION_SCHEMA+ Cloud Audit Logs + Cloud Billing. - The Logic: We map the exact volume of data scanned by a single SQL query to the identity of the executor (an employee’s email or a BI tool’s service account) and multiply it by the regional cost per terabyte.
- The Result: A clear hierarchy of spending. Instead of seeing a generic €10,000 monthly bill for BigQuery, the CFO sees a sorted leaderboard. The business can instantly identify if a specific data engineer, a runaway automated script, or a specific Looker dashboard is responsible for burning the budget.
2. Infrastructure Unit Economics
- The Integration: Cloud Billing + Internal Business Data.
- The Logic: We link cloud operational costs directly to business output metrics.
- The Result: Dashboards display metrics such as “Cost per Order” or “Cost per Report.” For example, if an advanced Data-Driven Attribution model (utilizing Markov Chains or Shapley values) requires €2,000 in monthly compute power to calculate, but the resulting insight only optimizes €500 in marketing ad spend, the system clearly highlights a negative infrastructure ROI. This shifts the conversation from “how much does the database cost” to “is this specific pipeline profitable.”
3. Inefficiency and Waste Monitoring
- The Integration:
INFORMATION_SCHEMA+ Storage Telemetry + Cache Utilization. - The Logic: We cross-reference physical storage costs with the frequency of queries and cache hit rates.
- The Result: The system flags architectural waste. It isolates “dead” data—massive tables that cost thousands of euros to store but have not been queried in over 90 days, making them perfect candidates for cold storage. It also identifies automated queries that constantly force expensive full-table scans or ignore the free system cache, allowing DataOps teams to refactor the code and immediately drop the baseline OPEX.
Data Security and Compliance: Absolute Data Sovereignty
When enterprise architects and Chief Data Officers evaluate observability tools, financial cost is only half the equation. The other half is data security and legal compliance.
In the European market, stringent regulatory frameworks like GDPR and the Schrems II ruling dictate how and where corporate data can be processed. Using a third-party SaaS observability platform inherently requires extracting terabytes of system metadata, user identities (such as employee emails in audit logs), and SQL query texts, and transmitting them to an external vendor’s servers. This creates immediate third-party risk, opens potential attack vectors, and requires extensive, time-consuming legal auditing.
A custom native architecture bypasses this risk entirely through the principle of absolute data sovereignty.
Isolated Internal Deployment
We do not host your monitoring system; we build it for you, exactly where your data already lives.
The entire FinOps and DataOps framework is deployed inside your existing GCP organization. We create a dedicated, highly restricted technical project specifically for observability. This project acts as a secure internal vault. Telemetry is routed into this vault using native GCP Log Sinks. Strict Identity and Access Management (IAM) policies are applied, ensuring that only authorized personnel—such as the CFO or Lead Data Engineer—can access the financial data and raw logs.
Zero Third-Party Risk
Because the architecture relies entirely on native GCP APIs and BigQuery as the central engine, your audit logs, query histories, and infrastructure metadata never leave your corporate perimeter. There is no external data extraction to third-party vendors, resulting in zero outbound data egress.
By-Design Regulatory Compliance
If your core GCP environment is localized in European data centers (for example, europe-west3 in Frankfurt or europe-west4 in Eemshaven), your FinOps telemetry remains exactly there.
This architectural decision guarantees out-of-the-box compliance with data localization directives. It completely removes the legal friction, risk assessments, and complex Data Processing Agreements (DPAs) required when onboarding external SaaS products. The business maintains 100% ownership and control over its infrastructure’s digital footprint, protecting both corporate secrets and employee privacy.
Applied Architecture: Real-World Case Studies
Theoretical frameworks only matter if they produce tangible financial and operational results. By deploying this custom FinOps and DataOps architecture, enterprises transition from a reactive state of simply paying invoices to a proactive state of infrastructure governance.
Here are two practical examples of how this native telemetry solves critical business problems.
Case Study 1: The Hidden Cost of BI Tools (Micro-FinOps)
The Problem: A large e-commerce platform managing hundreds of terabytes in BigQuery experienced an unexplained 40% month-over-month spike in data warehouse costs. Website traffic and transaction volumes remained completely flat. The internal engineering team spent days manually reviewing logs but could not pinpoint the exact cause among millions of daily queries.
The Discovery: We deployed the custom observability framework, linking BigQuery INFORMATION_SCHEMA with Cloud Audit Logs. Within the first 24 hours, the “Financial Footprint” dashboard isolated a massive anomaly. A newly hired data analyst had connected a corporate BI dashboard directly to a 5TB, unpartitioned raw events table using a “Direct Query” connection. Every time any manager opened or refreshed that dashboard, the database executed a full table scan across three years of historical data.
The Resolution & ROI: The dashboard was immediately repointed to an aggregated, materialized data mart built via Dataform. Furthermore, we configured an automated rule within the framework: any SQL query attempting to scan more than 500GB in a single execution would trigger an instant Slack alert to the DataOps lead. The company’s BigQuery bill dropped back below its original baseline, permanently saving thousands of euros each month.
Case Study 2: Proactive PII Tracking and Compliance (DataOps)
The Problem: A multinational retail enterprise faced severe GDPR compliance risks. They needed absolute certainty that no Personally Identifiable Information (PII)—such as unhashed customer emails or phone numbers—was leaking into their general analytics tables, where dozens of marketing analysts had read access.
The Discovery: Relying on human code reviews is insufficient for petabyte-scale data streams. Instead of exporting data to external security vendors, we built an automated PII tracker directly into their custom GCP observability project. The framework continuously ran RegEx (Regular Expression) scanners against the incoming payloads recorded in the Cloud Audit Logs.
The Resolution & ROI: The automated system immediately detected a frontend website bug that was accidentally appending unhashed customer phone numbers into URL parameters, which were then being ingested into the raw BigQuery tracking tables. The system automatically flagged the tables, alerted the security team, and isolated the data before it could propagate into the broader reporting layer. The business avoided a massive regulatory breach and established a permanent, automated security perimeter with zero third-party data egress.
Implementation Roadmap and Capital Expenditure
We do not operate as an outsourced coding agency billing by the hour; we engage as technical partners delivering a fully functional, enterprise-grade architecture. The deployment of a custom FinOps and DataOps framework is structured into a transparent, predictable timeline, typically completed within four to six weeks depending on the complexity of your GCP environment.
Phase 1: Infrastructure Audit & Design (Week 1) We begin with a deep dive into your current Google Cloud resource hierarchy, IAM policies, and Terraform configurations. Together with your financial and engineering leads, we define the exact business dimensions (departments, products, teams) that need to be mapped to infrastructure costs.
Phase 2: Foundational Pipelines (Weeks 2-3) We establish the secure, isolated observability project. Our engineers configure the automated Log Router Sinks to ingest Cloud Audit Logs and activate the Detailed Cloud Billing Export. We then set up the repository (using Dataform or dbt) to handle the automated SQL transformations directly inside BigQuery.
Phase 3: Business Logic and Visualization (Weeks 4-5) This is where the data becomes intelligence. We write the custom SQL models to calculate cache efficiency, storage waste, and unit economics (e.g., Cost per Order). We deploy the final interactive dashboards in Google Looker Studio, providing your management team with their new Cloud Command Center.
Phase 4: Alerting Middleware and Handover (Week 6) For critical anomaly detection—such as budget spikes or PII leaks—we deploy lightweight, event-driven microservices (written in F# or Python via Cloud Run). Finally, we conduct a complete handover. We transfer all documentation, architectural diagrams, and repository access to your internal DataOps team.
The Economics of the Build (CAPEX vs. OPEX)
The financial justification for this custom architecture is straightforward when evaluating the Total Cost of Ownership (TCO).
Depending on the scale of your organization (multi-region complexity, number of interconnected GCP projects, and specific alerting requirements), the engineering investment ranges from $5,000 to $15,000.
Crucially, this is a one-time Capital Expenditure (CAPEX). Once deployed, you own the code. There are no recurring monthly licensing fees based on data volume or user seats. Moving forward, your only operational expense (OPEX) is the native cost of running the queries and storing the logs inside your own BigQuery project—a cost that, in a well-architected setup, rarely exceeds a few dozen dollars per month.
Let’s Audit Your Architecture
A data warehouse is the engine of a modern enterprise, but without rigorous telemetry, it easily becomes a financial liability.
If your organization is ready to stop paying for inefficiencies and establish absolute transparency over its cloud infrastructure, we invite you to a technical dialogue.