
Building a Custom Analytics Pipeline: Routing Mobile and Web Traffic to BigQuery
In today’s digital world, data is the most valuable resource for any business. However, collecting, processing, and storing this data can become very expensive and technically complex. This is especially true for projects with high traffic, such as e-commerce platforms or popular mobile applications.
When a project generates millions of events every day, using standard commercial connectors and third-party tracking tools often leads to slow website performance, privacy issues, and huge monthly bills.
This article explains a modern, efficient, and cost-effective solution: a custom data pipeline. We will explore how to route all mobile and web traffic through a Server-Side Tag Manager, use a Pub/Sub message queue, process data with a custom Python connector, and store it in Google BigQuery. We will also look at the financial calculations for a project processing 22 million events per day.
1. The Technical Architecture
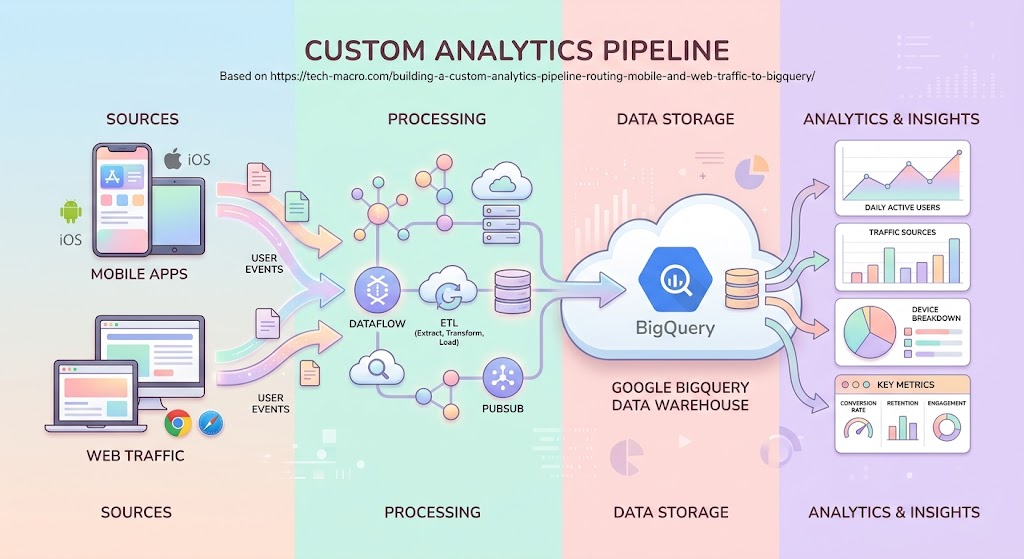
To understand why this system is better, we must first understand how it works. The architecture consists of five main steps: Data Collection, Server-Side Routing, Message Queuing, Data Processing, and Data Storage.
Step 1: Data Collection (Web and Mobile)
Traditionally, websites and mobile apps send data directly to services like Google Analytics or Facebook Ads from the user’s device (the client side). This slows down the application. In our modern approach, your web application (for example, built on the Nuxt framework) and your mobile apps send only one single stream of data to your own secure server.
Step 2: Server-Side Tag Manager (sGTM)
All the traffic from the user’s browser or mobile device goes to a Server-Side Google Tag Manager (sGTM) container. This server is located on your own cloud infrastructure (Google Cloud Platform).
- Security: You have full control over the data. You can remove personal information (like email addresses or phone numbers) before sending it anywhere else.
- Speed: The user’s device only loads one small script, making the Nuxt frontend and mobile app much faster.
- Accuracy: It helps bypass ad-blockers and tracking protections because the data is sent to a first-party domain (e.g.,
data.tech-macro.com).
Step 3: Google Cloud Pub/Sub (The Buffer)
After sGTM receives the data, it does not write it directly to the database. Instead, it sends the events to Google Cloud Pub/Sub. Pub/Sub is an asynchronous messaging service. Think of it as a waiting room for your data.
If your website suddenly gets a massive spike in traffic (for example, during a big sale), the database might crash if it receives too many requests at once. Pub/Sub safely holds the millions of events and guarantees that no data is lost.
Step 4: The Custom Connector
Next, we use a custom-built connector to take the data from Pub/Sub and move it to the database. This connector is usually written in Python and runs on a serverless service like Google Cloud Functions or Cloud Run.
This Python script reads the messages from the Pub/Sub “waiting room,” cleans the data, checks for errors, formats it correctly, and prepares it for the database.
Step 5: Google BigQuery and dbt
Finally, the custom connector streams the formatted data into Google BigQuery. BigQuery is a powerful data warehouse that can analyze petabytes of data in seconds. Once the raw data is inside BigQuery, data engineers can use tools like dbt (data build tool) to transform the raw events into clear, structured tables for business reports and analytics.
2. Financial Calculations: Processing 22 Million Events per Day
Let us look at the financial side. How much does it cost to run this custom infrastructure on Google Cloud Platform (GCP) for a large project?
The Baseline Metrics:
- Daily events: 22,000,000
- Monthly events: 660,000,000 (22M x 30 days)
- Average event size: 1 KB
- Total data volume per month: ~660 GB
Estimated Monthly Infrastructure Costs (GCP):
- Server-Side GTM Hosting (Cloud Run): To handle about 250 requests per second smoothly, you need a cluster of server instances.
- Estimated Cost: $80 – $120 / month
- Google Cloud Pub/Sub: Google charges for the amount of data transmitted. At roughly $40 per Terabyte.
- Estimated Cost: $26 / month (for 660 GB)
- Custom Python Connector (Cloud Run / Functions): Processing 660 million small messages continuously.
- Estimated Cost: $40 – $60 / month
- BigQuery Storage and Streaming Inserts: You pay for streaming data into the tables and for storing it.
- Streaming Cost: ~$33 / month.
- Storage Cost: ~$13 / month (active storage).
- Estimated Cost: $46 / month
Total Estimated Cloud Cost: $192 – $252 per month.
For processing more than half a billion events every month, a monthly infrastructure cost of ~$250 is incredibly low. This is the power of building a custom cloud architecture.
3. Custom Architecture vs. Commercial Connectors
Many companies choose to buy commercial SaaS (Software as a Service) connectors like Segment, Fivetran, or Supermetrics. While these tools are easy to set up, they have significant disadvantages when your project scales.
Here is a comparison showing why the custom Pub/Sub and BigQuery architecture is better:
| Feature | Custom Architecture (sGTM -> Pub/Sub -> BigQuery) | Commercial Connectors (e.g., Segment, Fivetran) |
| Pricing Model | Pay only for cloud resources used (Compute, Storage). | Pay per event, per row, or Monthly Active User (MAU). |
| Cost at 660M Events/Mo | ~$200 – $300 / month | $2,000 – $5,000+ / month (Costs grow exponentially). |
| Data Privacy (GDPR) | 100% First-Party. Data never leaves your Google Cloud environment. | Third-Party. You must send your user data to external company servers. |
| Flexibility | Unlimited. You can write custom Python code and dbt models for any specific business logic. | Limited to the features and integrations provided by the vendor. |
| Vendor Lock-in | None. You own the code and the infrastructure. | High. It is very difficult to migrate away once integrated. |
The Problem with Commercial Pricing
The biggest issue with commercial tools is their business model. They charge based on the volume of data. If your marketing campaign is successful and traffic doubles, your analytics bill also doubles. With our custom GCP architecture, the cost scales very slowly. Moving from 22 million to 40 million events a day might only add $50 to your Google Cloud bill, whereas a commercial tool would demand an expensive “Enterprise” contract upgrade.
Complete Data Ownership
When using a commercial connector, you are giving a third-party company access to your user’s behavior. In an era of strict privacy laws like GDPR and CCPA, this creates legal risks. With a custom server-side container and BigQuery, the data pipeline is completely private. You are the sole owner of the data from the moment the user clicks a button on your website until the data is visualized in a report.
Conclusion
Routing web and mobile traffic through a Server-Side Tag Manager, buffering it with Pub/Sub, and processing it into BigQuery is not just a technical upgrade; it is a smart business strategy.
While it requires more engineering time to develop the initial Python connectors and dbt models, the long-term benefits are massive. For a project generating 22 million events daily, this custom architecture provides an incredibly fast frontend experience, total control over data privacy, and saves thousands of dollars every single month compared to commercial alternatives. It transforms analytics from an expensive operational cost into a secure, highly scalable, and profitable company asset.